ObjectiveFS supports latency heatmaps in version 4.1 and newer. The latency heatmaps are useful for performance tuning and are not for production use.
Mount OFS in the foreground with “-v” switch.
$ sudo mount.objectivefs mount -v <filesystem> <directory>To toggle between latency heatmaps, press Ctrl-\ to send the SIGQUIT signal to ObjectiveFS.
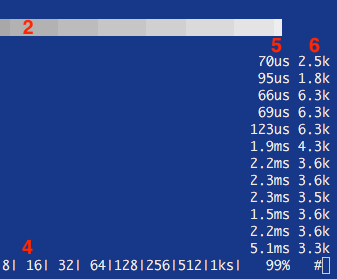
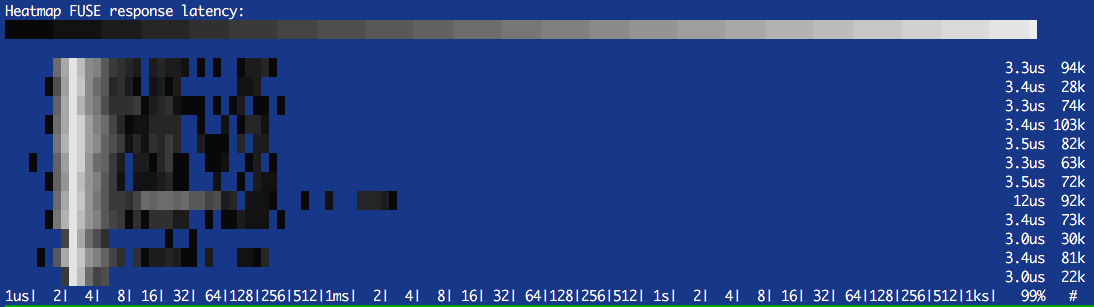
5. 99th percentile of latency for the events on this row.
6. Total number of events on this row.
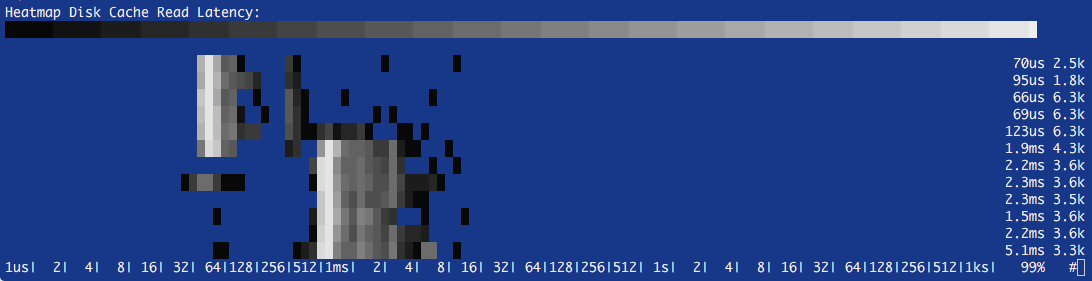
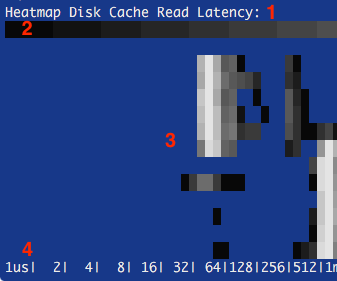
The disk cache read latency heatmap above shows two clusters of reads. The initial faster reads (40-80us) show hits in the kernel cache, and the second group of reads (0.5ms-1.5ms) show hits in the disk cache.
last updated by ObjectiveFS staff, March 7, 2025
ObjectiveFS is a shared file system for OS X and Linux that automatically scales and gives you scalable cloud storage.
If you have questions or article idea suggestions, please email us at support@objectivefs.com